

By Robert Majdak Sr. MBA
Management Insights Group, LLC
August 10, 2026
I have built my practice on converting ambiguous data into defensible business decisions, and few disciplines demand that translation more than organic search performance in an e-commerce environment. Most organizations treat search engine optimization (SEO) as a checklist of tactics executed in isolation from financial outcomes. I treat it as a measurement problem. Search generates an enormous volume of correlated indicators, and the analyst’s obligation is to isolate the small number of variables that demonstrably move revenue, then discard the remainder without sentimentality. Collecting data is trivial; determining which observations carry genuine predictive weight, and then defending that determination under executive scrutiny, constitutes the substantive analytical work.
The Measurements That Predict Revenue
Four measurements form the analytical foundation, and none of them is interpretable in isolation. Impressions quantify latent demand: how frequently the domain surfaced against a commercial query, irrespective of whether anyone clicked. Average Position establishes competitive placement within that demand pool. Click-through rate measures the persuasive efficiency of the title, structured data, and description at a given placement. Revenue per organic session converts the entire apparatus into currency, which is the only unit management is obligated to care about.
The diagnostic value emerges from the relationships among them. Impressions climbing while click-through rate deteriorates indicates the domain is surfacing against queries it has no authority to satisfy, which signals a relevance mismatch rather than a growth trajectory. Position improving while revenue per session remains flat indicates the site is winning rankings for terms carrying informational rather than transactional($) intent. Both patterns are frequently reported to leadership as successes, and neither one qualifies.
Segmentation Precedes Interpretation
Aggregate, site-wide search metrics are analytically worthless, and I refuse to present them. The first operation I perform on any dataset is segmentation along three dimensions.
- The first and most consequential split separates branded from non-branded queries. Branded search volume reflects advertising expenditure, public relations, and reputation, not search optimization competence. Analysts who neglect this separation routinely attribute demand-side lift generated by a paid campaign to their own technical work, which corrupts every subsequent budget decision the organization makes.
- The second dimension is query intent, classified as transactional, commercial investigation, informational, or navigational. Each classification carries a materially different conversion expectation, and blending them produces a weighted average that accurately describes no actual customer in the population.
- The third dimension is page template. Category pages, product detail pages, and editorial content behave as distinct populations with distinct conversion mechanics. Analyzing them jointly obscures the very variance the analysis exists to explain.
Technical Health Functions as a Ceiling
Content strategy cannot outperform the technical infrastructure beneath it, so I quantify the condition of that infrastructure before recommending discretionary investment in anything else. Index coverage reports reveal how much of the commercially viable catalog search engines have actually accepted. Server log analysis reveals how crawler attention is distributed across the domain, and the distribution is almost always pathological. When a majority of crawl requests are consumed by faceted navigation parameters, internal search results, and expired inventory, the site is spending a finite and non-negotiable resource on assets incapable of producing revenue. Correcting that allocation frequently generates more incremental traffic than a quarter of content production, at a fraction of the cost.
I evaluate page experience metrics with deliberate skepticism. They influence rankings modestly but influence conversion substantially, which means their business case rests on the transaction($) rate rather than the ranking benefit. I present them accordingly.
The Analytical Method
I establish a thirteen-month baseline before asserting that anything has changed, because comparison against an insufficient window mistakes seasonality for performance. I decompose the traffic series into trend, seasonal, and residual components, then examine the residual, since that is where genuine intervention effects reside.
I then control for confounders that competing analyses ignore. Algorithm updates, promotional calendars, inventory availability, and paid media flighting(cadence, intensity) all displace organic behavior, and attributing their effects to optimization work is the most common analytical failure in this field. My preferred instrument is a difference-in-differences design (DiD): I deploy a change to a defined subset of comparable pages, hold a matched control group untouched, and measure divergence between the two cohorts. That structure converts a correlational observation into something approaching a causal claim, which is the standard any recommendation carrying budget implications should satisfy.
Finally, I apply significance thresholds and confidence intervals to every reported result. Organic traffic is volatile, and a substantial share of week-over-week movement is indistinguishable from noise. Declaring victory on noise destroys analytical credibility permanently, and credibility is the only asset an analyst possesses.
Translating Analysis Into a Management Narrative
Executives do not fund metrics. They fund outcomes, and the analyst’s final responsibility is to make the outcome legible. I structure every finding as three sentences: what changed, what it is worth in annualized revenue, and what decision it now requires from the leadership team.
The valuation arithmetic is straightforward and should always be shown. A keyword cluster generating fifty thousand monthly impressions at an average position of eight earns roughly a two percent click-through rate. Advancing that cluster to position three raises the expected rate to approximately nine percent, producing thirty-five hundred incremental monthly sessions. Applied against a two percent conversion rate and a one-hundred-dollar average order value, that movement represents seven thousand dollars in monthly revenue, or eighty-four thousand annually. I then attach the estimated cost of achieving it, the probability of success given competitive difficulty, and the expected time to realization.
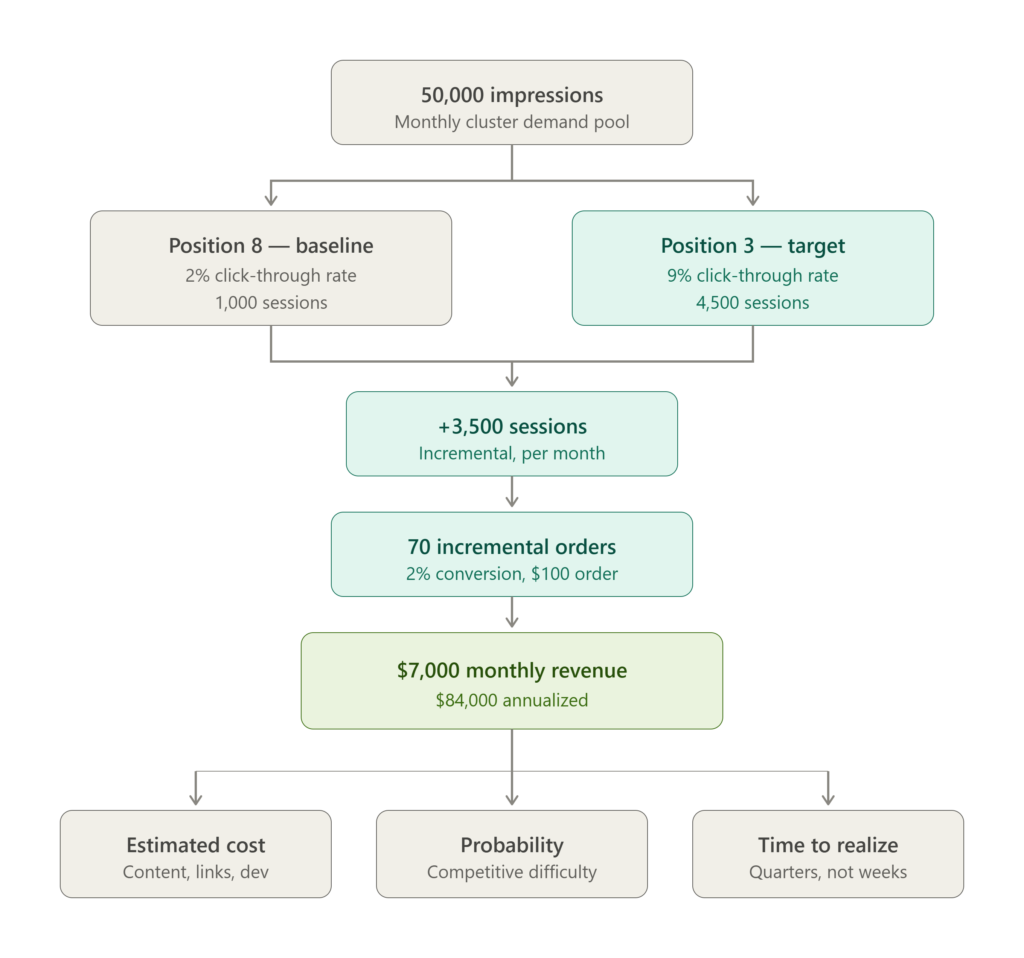
Figure 1 Diagraming the valuation arithmetic (See Note 1)
That framing accomplishes something no dashboard achieves. It converts an abstract ranking improvement into a capital allocation decision that a chief financial officer can evaluate against every other proposal competing for the same dollars. I present one chart per idea, lead with the recommendation rather than the methodology, and reserve the statistical apparatus for the appendix where it belongs. Management does not need to understand the regression. Management needs to trust that one was performed.
The Standard I Hold
The organizations that win in organic search are not those with the most data. They are those with the discipline to segment it correctly, the rigor to test causally rather than assert confidently, and the communication capacity to render technical findings as financial arguments. Every analysis I deliver answers one question: what is this worth, and what should you do about it. Anything that fails to answer that question is not analysis. It is decoration, and decoration does not grow revenue.
Figure 1 Notes
“Position” is the ranking slot a page occupies in the search results for a given query. Position 1 is the first organic result on the page, position 2 is the second, and so on. Position 8 means your page typically shows up eighth in the list; position 3 means third.
Two things make this more nuanced than a simple counting exercise, and both matter for the valuation.
First, it’s an average, not a fixed placement. Search Console reports average position across all impressions for that query or cluster. A cluster sitting at 8.0 isn’t ranking eighth every time — it may rank fourth for some queries in the cluster, twelfth for others, and vary by device, location, and personalization. The average is a summary statistic, and like any mean it conceals the distribution beneath it. I always look at the variance before treating the average as actionable.
Second, and this is the part that drives the arithmetic: click-through rate does not decline linearly as position increases. It decays sharply. The top three results absorb the overwhelming majority of clicks, and by the time you reach position 8 you are usually below the fold on desktop and several scrolls down on mobile. That’s why moving from 8 to 3 produces a roughly fourfold click-through improvement — two percent to nine percent — rather than the modest gain you’d expect from advancing five slots. You aren’t moving five steps along a ramp; you’re crossing from the ignored tail into the visible zone.
The five-position figure in the example is deliberate. It’s a meaningful but achievable move — the kind of gain that follows from real content and authority work. Modeling a jump from position 8 to position 1 would inflate the revenue number while quietly dropping the probability of success to something close to zero, which is exactly the sort of estimate that erodes credibility with a CFO.
One caution on the underlying rates: the two percent and nine percent figures are industry-wide averages from published click-through curves. Your actual curve depends on query intent, whether paid ads and shopping carousels occupy the top of the page, and how much vertical space AI-generated summaries consume before any organic result appears. I pull the real curve from your own Search Console data by plotting observed click-through rate against observed position across the site, then use those coefficients rather than the published benchmarks. The published curves are fine for illustration in an article. They are not fine for a number attached to a budget request.
-MIG
© Management Insights Group, LLC
Dallas/Fort Worth Texas Office