
Business Plan Pivot — KPI Interrelationship Timeline
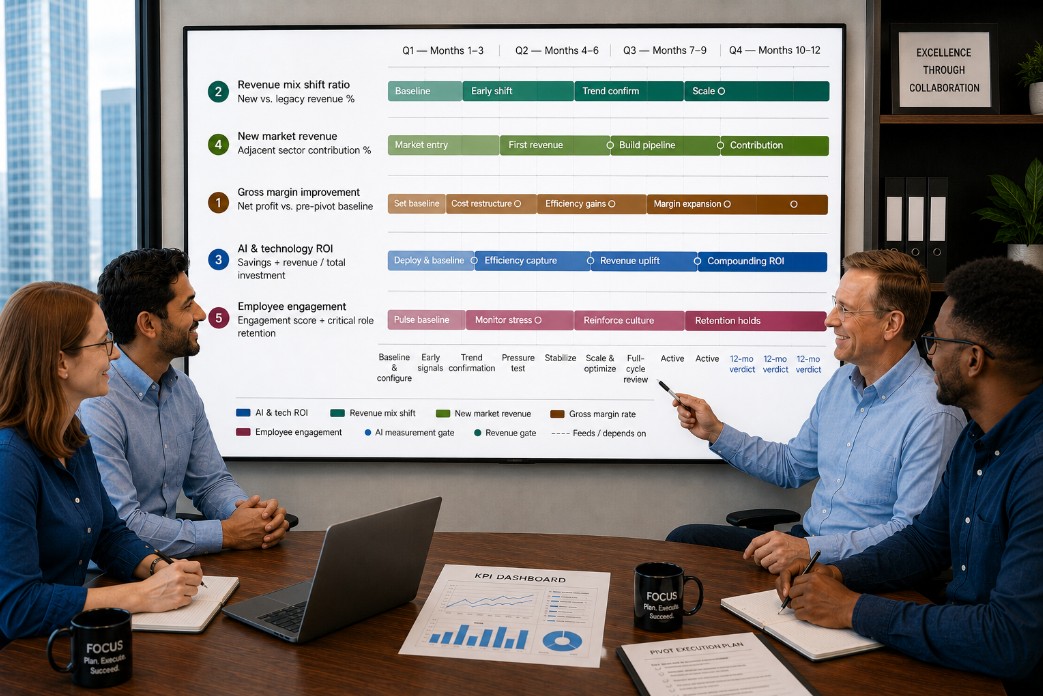
12-month post-implementation view.
By Robert Majdak Sr. MBA
Management Insights Group, LLC
June 7, 2026
Business plan pivot — KPI interrelationship timeline
12-month post-implementation view. Hover any bar to see phase detail.
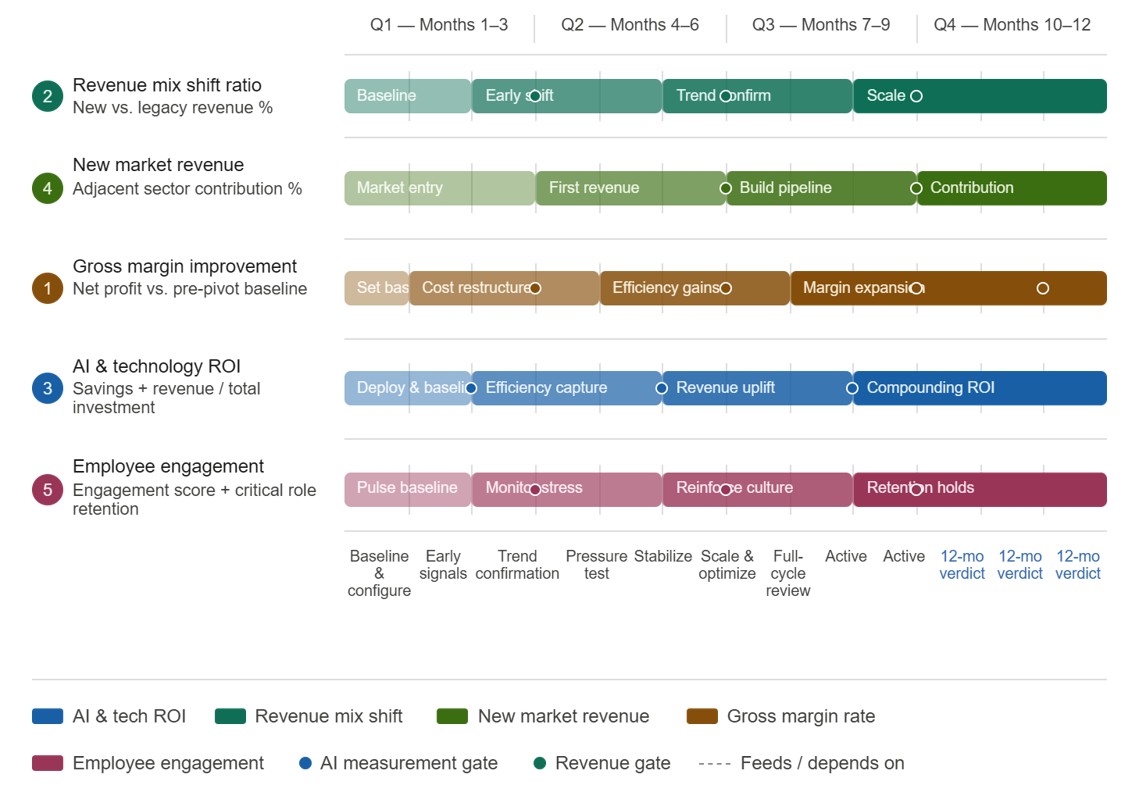
Here's how to read the chart and the relationships it reveals:
Sequencing logic. The five KPIs are ordered by when they generate their first meaningful signal. Revenue Mix Shift and New Market Revenue start early but pay off late. Gross Margin Improvement has the shortest setup window — get the baseline right in month one or you lose your benchmark. AI & Tech ROI builds in two distinct waves: cost savings first (months 3–6), then revenue uplift (months 6–9). Employee Engagement is the only KPI that runs hot in the middle — months 4–7 are when change fatigue peaks and retention risk is highest.
The dependency chain. The four dashed lines in the legend represent the critical interrelationships:
- Employee Engagement feeds Revenue Mix Shift — an unengaged team cannot execute a business model transition
- AI ROI feeds Gross Margin Improvement — technology efficiency is the primary driver of margin expansion before new revenue materializes
- New Market Revenue feeds Revenue Mix Shift — adjacent sector wins are what actually change the ratio
- Revenue Mix Shift confirms Gross Margin — once the revenue mix is shifting, margin should follow within one quarter
The 12-month verdict zone (months 10–12) is where all five bars reach full opacity simultaneously. That convergence is intentional — no single KPI tells the full story, but if all five are trending in the right direction by month 10, the pivot is working.
The measurement gates (colored dots) are your monthly check-in moments. Missing two consecutive gates on any KPI is the signal to diagnose before the quarter closes.